1. Outliers Auto - Progressive filter of outliers with termination at 99.9% correlation coefficient or until only four data points remain, whichever happens first. This is accomplished in a similar manner as the Manual filter. Fig. 1 and Fig. 2 below illustrates this option.
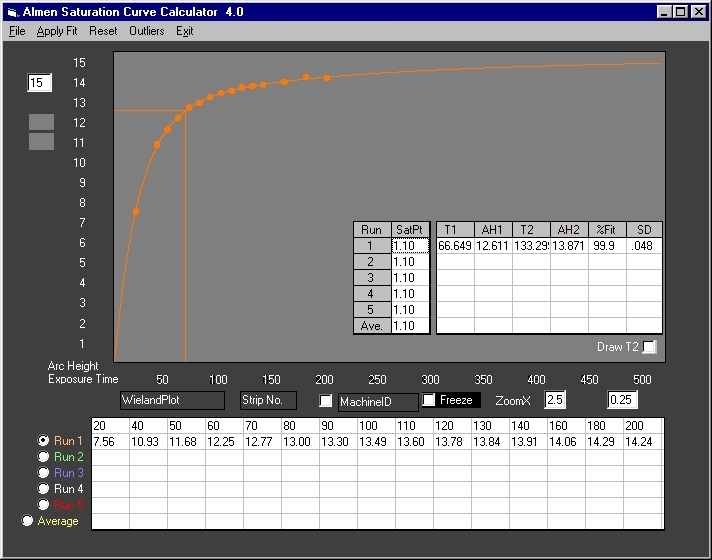
Fig. 1 Plot of the Wieland(1) data using the True Almen Saturation Curve Model. Excellent correlation of 99.9% with a standard deviation of .048 (.000048in).
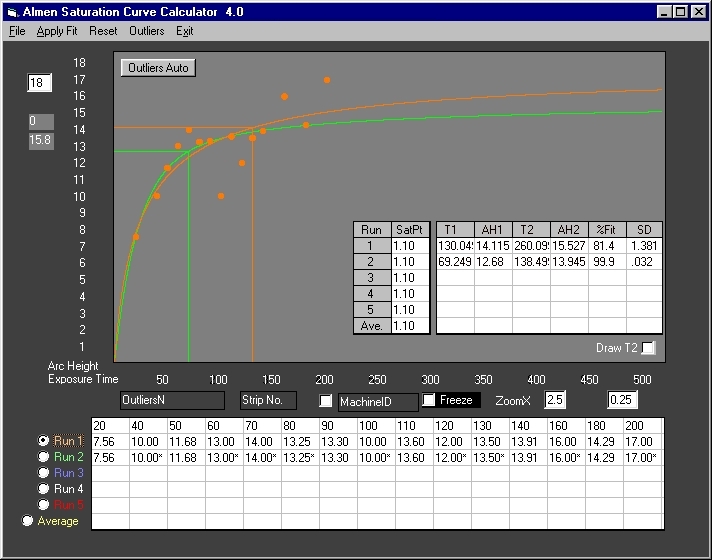
Fig. 2 Data from Fig. 1 with multiple outliers introduced at random points. Run 1 (orange) is the unfiltered plot - correlation is poor at 81.4% with a significant error of 1.381 (.001381in). Run 2 (green) is plot of filtered data, terminated at 99.9% correlation (identified outliers are flagged with asterisks). Calculated values are comparable to those of Fig. 1.
(1) Wieland R. C. "A statistical Analysis of Shot Peening Intensity Measurement", pp 27-38, Proceedings I.C.S.P.5, Oxford, 1993