Outliers are random points in data sets that adversely affect the shape and accuracy of computer generated Almen Saturation curves. These points, unless obviously outside the norm, cannot be identified and eliminated. This being the case, generated curves and calculated saturation points are unreliable - unless multiple runs are made and averaged. (This of course takes more time and offers no assurance that the problem with outliers has been dealt with.)
A major revision in Almen Saturation Curve Calculator 4.0 is the incorporation of a trap that filters outliers in a manner similar to a screen that filters particles of different sizes. This trap has a screen with holes ranging from .01 to 1.00. The smaller holes filter data points very close to the Almen Saturation Curve while the larger ones trap only those that are obvious outliers. Practically all outliers can be filtered in this manner particularly if progressively smaller trap numbers are used.
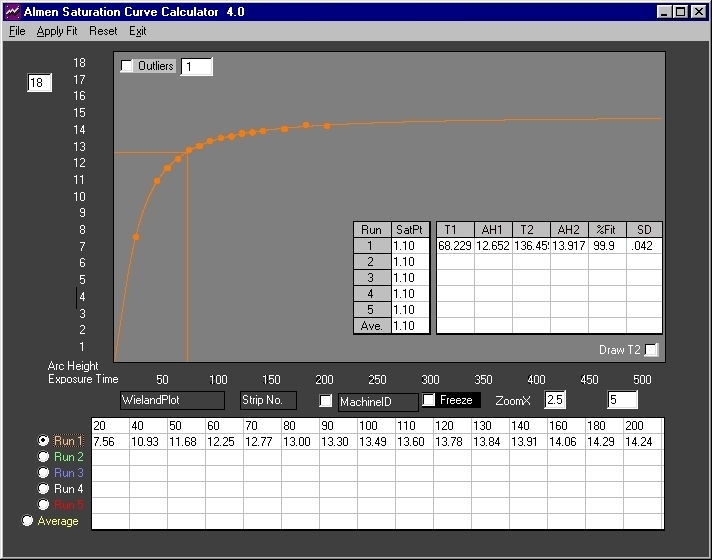
Use of the outliers trap is illustrated below with the Wieland(1) data.
Fig. 1 Plot of Wieland data. The average of 25 data sets - all arc heights are in inchesx1000. Correlation of 99.9% is excellent with a Standard Deviation of +/-.042 (+/-.000042 inch).

Fir 2. Data from Fig. 1 with obvious outliers introduced at exposure times 100 and 160. Correlation drops to 86.4% with a Standard Deviation of +/-1.031 (+/-.001031 inch).

Fig. 3 The outliers filter is enabled with the trap at the largest setting of "1". The outliers were filtered - plotted points are marked with black dots and data is flagged with asterisks. Calculated results are comparable to those of figure one.
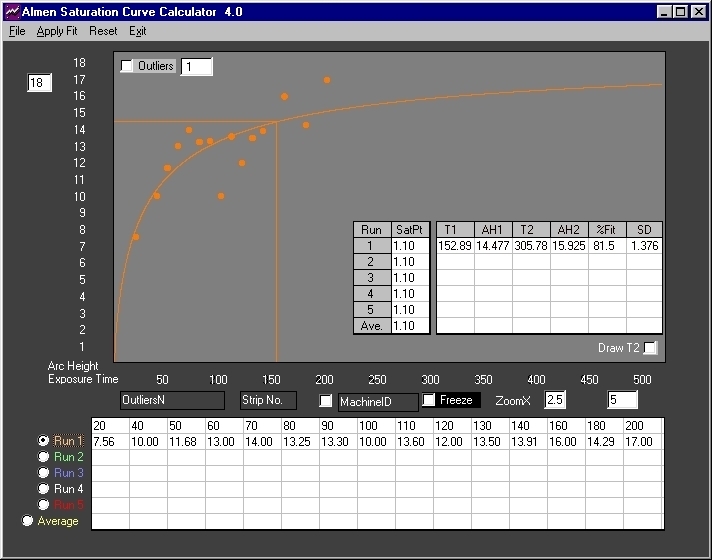
Fig. 4 Multiple outliers were introduced above. Visual examination of the plot does not disclose any obvious outliers. Calculated results show very low correlation and large Standard Deviation.

Fig. 5 The outliers filter is enabled with the trap at the largest setting of "1". Five points are disclosed and correlation increases to 98.2% with an error of +/-.000394 inch.

Fig. 6 The outliers filter was reset to ".5". Two additional outliers are eliminated - previously identified outliers are shown as smaller dots. A further improvement in correlation and error is realized.

Fig. 7 A smaller outliers filter of ".25" is used. One more outlier is identified and the drawn curve is almost a perfect fit. Calculated results are comparable to those of Fig. 1. Further traps are not needed. All relevant outliers have been identified and eliminated.
The outliers filter works equally well with small data sets as shown below:
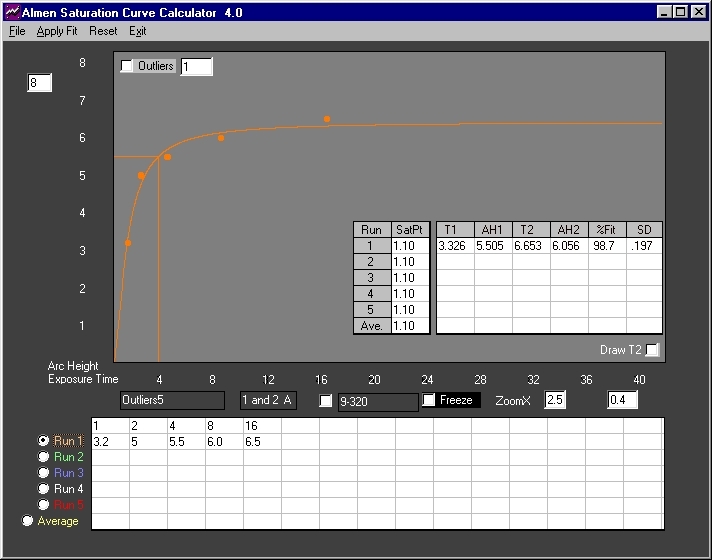
Fig. 8 Five point data set(2) with apparently multiple outliers. Correlation is good at 98.7% and error of +/-.000197 inch is low. Visual inspection of the plot does not disclose any obvious outliers.
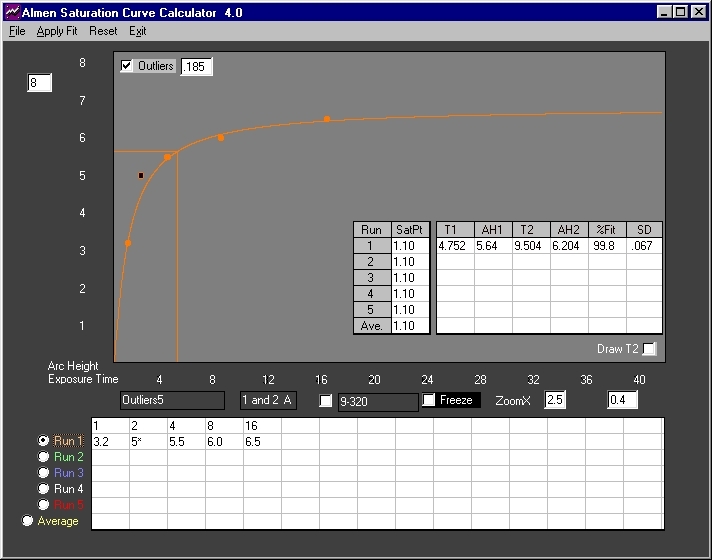
Fig. 9 The outliers filter is enabled with a setting of ".185". One outlier is identified and flagged. Correlation improves to 99.8% with and error of +/-.000067 inch - an excellent fit.
One question must be answered.
How reliable is the filter?
The filter is a tool developed to trap outliers in Almen data sets. It is particularly useful in situations where data points are equidistant from the curve as in Fig. 8 above. The final filtered curves fit the expected shape - rapid initial propagation, followed by a sharp knee, then, a gradual almost linear increase with a slope approaching zero.
The Wieland data was filtered with verifiable excellent results. The filtered plot of the Peenforming data generated a curve with the characteristic shape.
The outliers filter is an excellent tool. However, like all tools, results are dependent on the experience and skill of the user. Using a setting that is too large will miss relevant outliers. On the other hand, a setting that is too small will eliminate valid data points. Progressive filtering must be undertaken in small incremental steps and terminated when results are satisfactory. The filter is reliable but results are entirely dependent on the judgment of the user!
(1) Wieland R. C. "A statistical Analysis of Shot Peening Intensity Measurement", pp 27-38, Proceedings I.C.S.P.5, Oxford, 1993
(2)Peenforming.squarespace.com