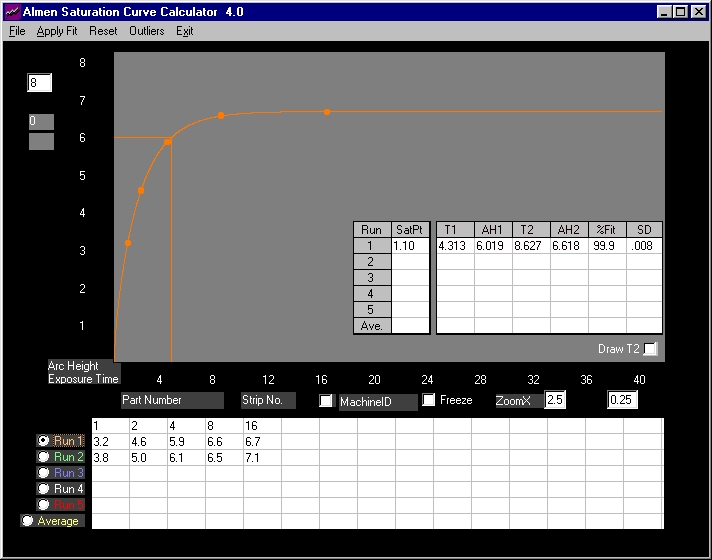
Fig. 1 (Before) IPW1837 was peened at 6.019A at the start of the run (T1=5 passes)

Almen Saturation Curve Calculator 4.0
Introduction For details e-mail: peenforming@hotmail.com
The shape of Almen Saturation curves has distinct characteristics - a rapid initial increase in arc height/time followed by a sharp "knee", after which, increases in arc height/time are at a much lesser rate but appear to continue indefinitely. Saturation is defined as the point on the curve where, doubling the exposure time, results in arc height increases of 10%. This is a straightforward specification.
However, actual determination of Almen Intensity is a complicated processes as illustrated by the hypothetical part below:
Part Number: IPW1837
Intensity: .0050A to .0070A
Strip Locations: 1, T1, Before, After
Coverage: 200%
The part can be peened only by making multiple passes until 200% coverage is attained. Fractional passes are not possible (i.e. by increasing pass-speed). Almen strip fixture simulates the part. Setup run is shown below - all arc heights are in/1000.
Pass 1 2 4 8 16
Before
Arc Height 3.2 4.6 5.9 6.6 6.7
After
Arc Height: 3.8 5.0 6.1 6.5 7.1
It would appear that IPW1837 was peened at the start of the run at an intensity of >5.9A and <6.6A (at T1 >4 and T1<8). At the end of the run, the part was peened at >5.0A and <6.1A (at T1 >2 and T1<4). Intensity was within the range at the start of the run. It also appears to be within range at the end of the run.
Uncertainties and inaccuracies are eliminated with the Almen Saturation Curve Calculator 4.0 since it draws a curve that represents the true shape of Almen Saturation Curves. Estimated intensities are supported by data and experience.
Software Curve Generation :
Fig. 1 (Before) IPW1837
was peened at
6.019A at the start of the
run (T1=5 passes)
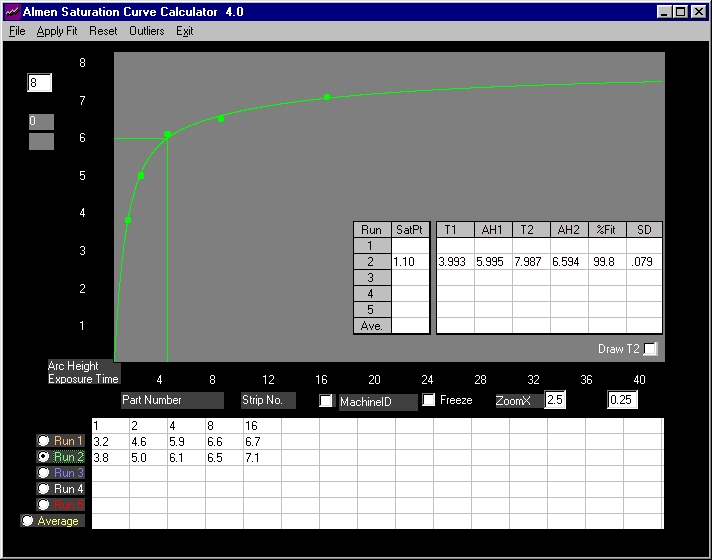
Fig. 2 (After) IPW1837 was peened at an intensity of 5.995A at the end of the run (T1=4 passes)
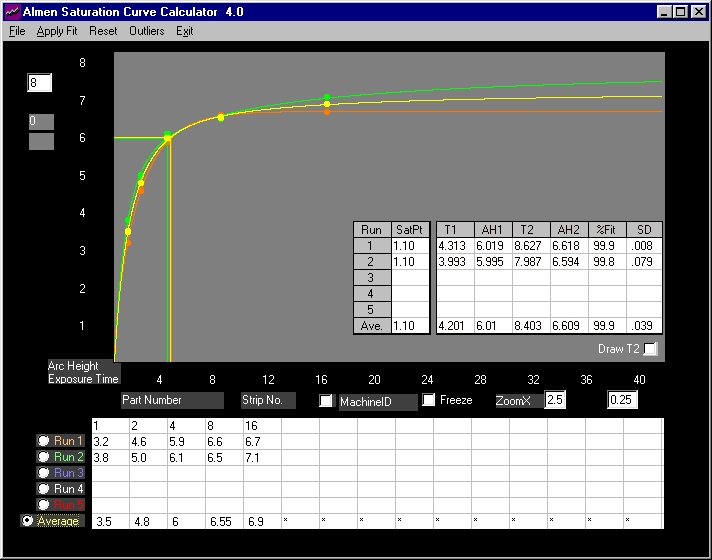
Fig. 3 (Average Intensity) IPW1837 was peened at 5.995A to 6.019A for an average of 6.01A , average T1=5 passes.
Features:
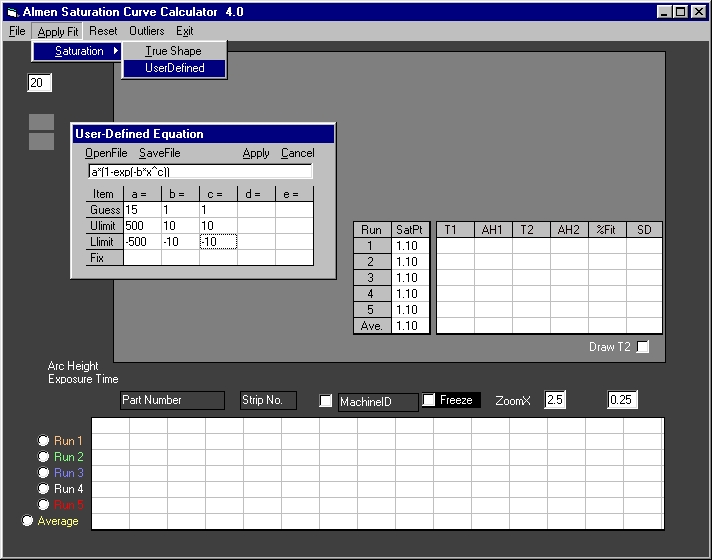
Fig. 4 (Format Flexibility) Powerful features designed to meet unique and variable requirements that may be encountered in use.