
T2 Display and Suppression
Almen Saturation Curve Calculator 4.0
A graphic display of T2 (twice the exposure time for saturation) may be shown by checking the box after "Draw T2".
Fig.1. A check mark in the box after "Draw T2" forces a graph of points that lie at twice the exposure time for saturation. Although desirable, it tends to present "clutter" particularly as shown above where five sets have been entered and the average taken. It would probably be best to select this option for just one or two sets, or select for some sets and de-select for others.
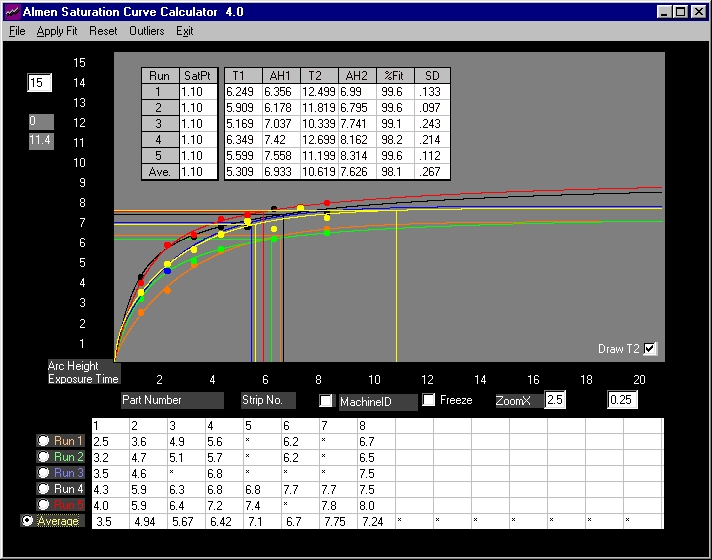
Fig.2 "Draw T2" was selected just for the average of the five runs. All relevant information is presented in a graph that is easier to analyze.