This feature may be used to evaluate other models of the Almen Saturation Curve and validate these against the True Shape of Almen Saturation Curves. One such model is an Avrami equation(2):
f(x) = a(1-exp(-bxc))
Below are plots of this equation (see notes)
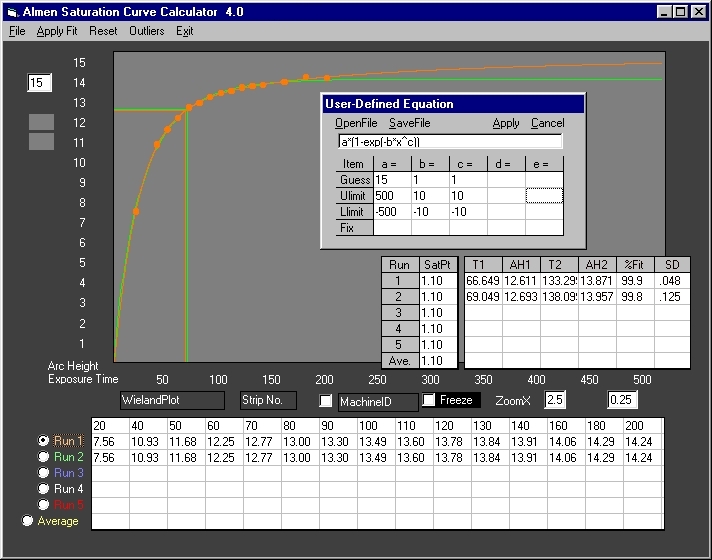
Fig. 1 Run 1 (orange) is the true Almen Saturation Curve for the Wieland data. Run 2 (green) is the Avrami equation curve. For this data set the Avrami model closely approximates the true shape. It fails on other data sets as shown below.
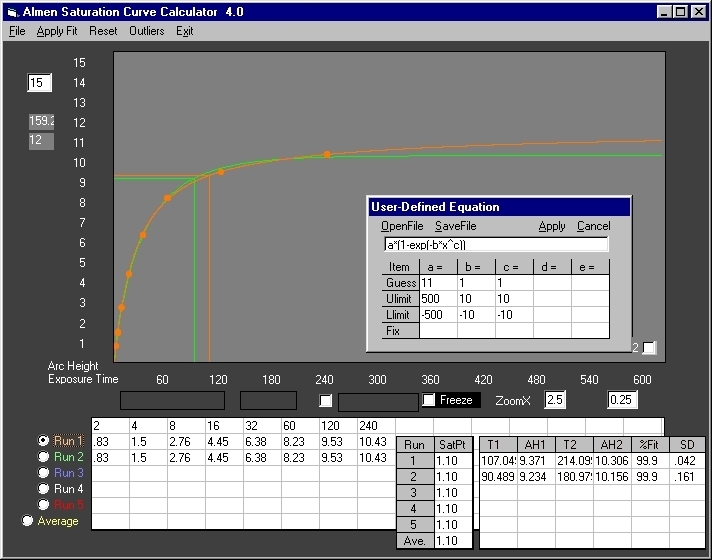
Fig. 2 Run 1 (orange) is the true shape of the Peenforming(2) data. Run 2 (green), the Avrami equation curve, is obviously wrong. The calculated intensities are comparable. However, the Avrami equation exposure time is 17 (seconds) less than the true shape with a consequent four-fold error. It is unlikely that the Avrami intensity can be qualified in an actual run.
Notes:
1.The Almen Saturation Curve Calculator is based on a single equation that is applicable to any data set of any number of points (the minimum of course is 4). Its development included evaluation of many standard models, including Avrami equations, all of which worked with some sets but failed in others.
With careful analysis of data sets, it may be possible to apply certain equations to certain sets with acceptable results. However this approach is cumbersome, inaccurate, prone to error and misinterpretation. The feature User Defined Equation is provided as a tool for validating the accuracy of other models of the Almen Saturation Curve.
2. Equations are entered in the upper box of the user window. It accepts a maximum of five coefficients (a to e), one independent variable (x) and the more common functions and operators (+, -, *, /, ^, (), exp, log, sin, cos, tan, atn, abs, sqr)
3. The table below the equation box accepts four entries for each coefficient:
Guess - (Required) This is the starting value for the initial nonlinear regression of coefficients. It does not have to be accurate, however, the closer this value is to the actual coefficient, the faster the regression. In Avrami equations, the coefficient "a" is very close to the maximum arc height. Therefore, 15 and 11 were selected for the Wieland and Peenforming data respectively. The coefficients "b" and "c" range from <1 to <5. Therefore, "1" was used for both in the two data sets.
Ulimit - (Required) The coefficient upper limit. In Almen Saturation curves, the coefficient "a" (arc height) cannot be greater than 24 (.024 inch). +500 was used for a larger degree of freedom. For the same reason, +10 was used for the exponents "b" and "c". (Avoid using a larger upper limit for exponents; it is unnecessary and may result in an overflow error).
Llimit - (Required) The coefficient lower limit. Almen arc heights never become negative, therefore Zero is the minimum. However, in order to cover a larger regression space, -500 was used for coefficient "a" and -10 for both "b" and "c".
Fix - (Optional) The number "1" (or any number other than zero) in any box forces Guess to a constant. Regression is prevented on flagged coefficients and the value is used in drawing the curve. Useful in "what if" analysis, as well as determining initial values in complex models that are difficult to resolve or tend to diverge.
(1) Wieland, R. C., "A Statistical Analysis of the Shot Peening Intensity Measurement", pp27-38,
Proceedings I.C.S.P.5, Oxford, 1993