Almen Saturation Curve Calculator 5.0
Features For details e-mail: peenforming@hotmail.com
Retaining all the functions of Version 4.0, the following powerful features extend the versatility of version 5.0:
1. Variance and Standard Deviation: Cells summarizing results are modified to show the absolute mean variance of
data from the calculated curve as well as the standard deviation.

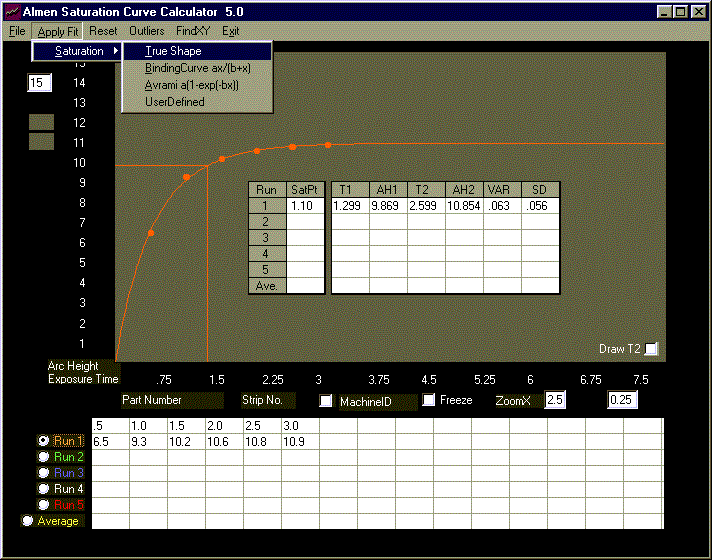
Fig1. Run1 (orange) is the True Shape plot data.
The True Shape model is used to trace the curve above. It calculates T1 and T2 as well as the absolute mean variance
(VAR) and Standard Deviation (SD). In this case, curve fit is excellent having a mean absolute variance of .063 and a
standard deviation of .056 (.000063in +/- .000056in).
2. FindXY function At times, certain points on the saturation curve are required. For example, the arc height at
a certain exposure time is required, or the compliment; exposure time for a given arc height. Find Y yields the
arc height and Find X yields the exposure time.
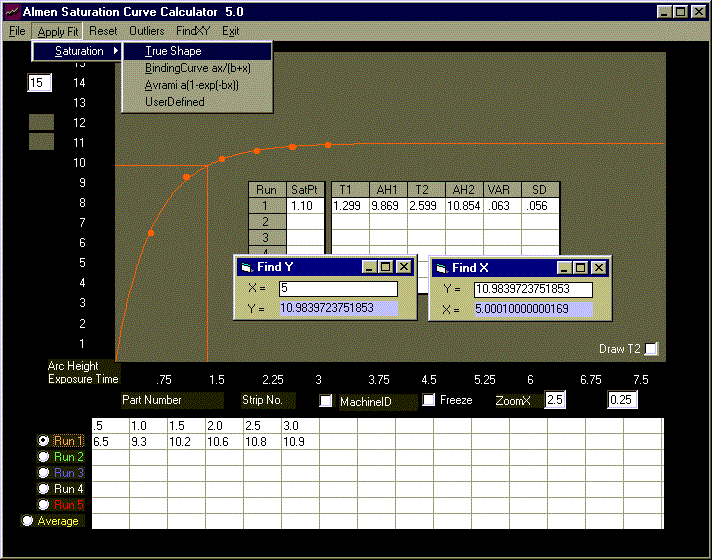
Fig2. The function "Find Y" when the exposure time is 5 minutes yields an arc height of 10.983...3 (0.010983...3in). The
compliment, "Find X", when the arc height is that from "Find Y" yields an exposure time of 5.000..9 minutes,
or 5 minutes for all practical purposes. (It takes longer to calculate the value of "X" than it does for "Y". The
function therefore calculates a number that is within +/- .0001 of the exact value. In this case 5.0001 = 5. Note
that the calculated "Y" value is exact.)
Of interest is investigating the shape of the curve at extended exposure times. The function "Find Y" can be called
for this purpose.
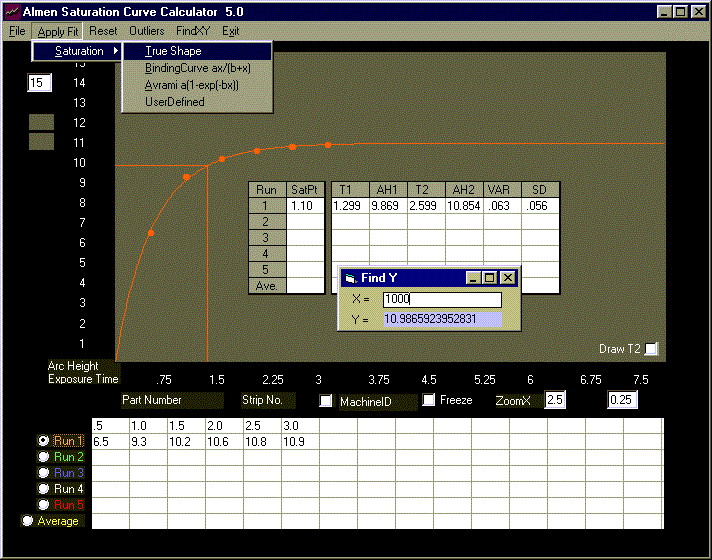
Fig3. With "X" set at 1000 minutes, "Find Y" yields a value of 10.986...1. While not significantly larger than that when "X"
is 5 minutes (10.983...3), this shows that the slope of the curve approaches, and may become, zero at extended
exposure times. This is the true shape of the Almen Saturation Curve.
3. User Defined Equation The dialog box is upgraded to display the values of coefficients.
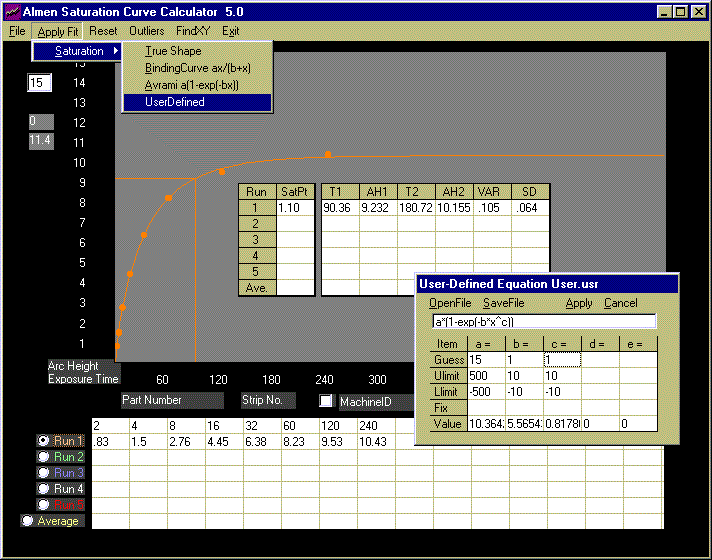
Fig4. Values of coefficients calculated with the UserDefined model are displayed at the bottom of the user dialog box.
These can be re-entered as fixed values in "what if" situations or manipulated in any other manner. Refer back to
Version 4.0 for details on entering data in the dialog box.
Note that the value for coefficient "b" (5.5654...) appears to be unusually large. In fact, upon substitution, it yields
unreliable
arc heights. (At an exposure time of 16, the calculated arc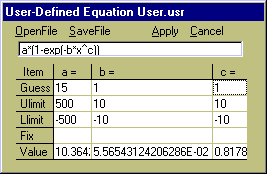
height is very close to 10.364)
The column for coefficient "b", shown on the right, was expanded
to display its entire content; 5.5654...6E-02, or .055654...6.
This value, substituted in the equation, yields an arc height of
4.308... at the exposure time of 16.
The function FindY may also be called with x=16 to calculate arc height at this exposure time.

Variance is 4.45 - 4.31 = 0.14,
well within the absolute mean of
.105 +/- .064 (.000105 in +/- .000064 in)
All columns of the dialog box may be expanded (or collapsed) as required.