SAE J2597 Data Sets
For details e-mail: peenforming@hotmail.com
A major problem in computer generated Almen Saturation Curves is to decide on an acceptable equation that will trace a satisfactory shape. It may be possible to select a model of "best fit" for different data sets. However, this approach is subject to error, bias and unreliable results.
To work around this problem, the SAE Sub-Committee on computerized curve fitting has provided 10 data sets to test computer software. The requirement is that any fitting equation is acceptable provided it yields derived peening intensities within ± 0.001" of target intensities when applied to the reference data sets.
Below are the results using a single equation that models the True Shape of Almen Saturation Curves. All data are expressed as inch x1000. For example, 0.0046" is presented as 4.6, 0.0087" as 8.7, and so on.
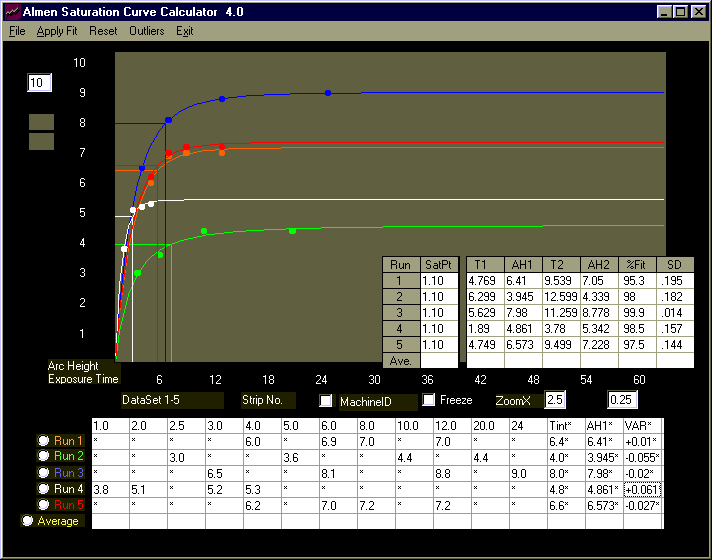
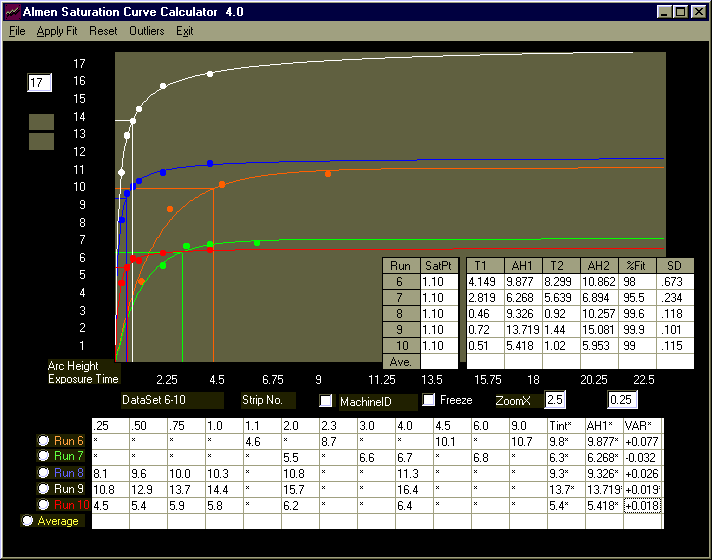
Target intensities are listed under "Tint*" and those derived under "AH1*". The asterisks (*) in the data are flags for the software to disregard these values. Overall, variance from target intensities, "VAR*", range from
-0.055 (-0.000055") to +0.077 (+0.000077"). As well, goodness of fit (shown as %Fit) is excellent and range from 95.3% to 99.9%. This, together with the generated shapes, confirms that the curve is in fact the True Shape..

Fig. 1 Data sets 1-5 (labeled Run 1 to Run 5) are traced to an excellent fit of from 95.3% to 99.9%. Variance from
target intensities are negligible and range from -0.055 (-0.000055") to +0.061 (+0.000061").

Fig. 2 Data sets 6-10 (Run 6 to Run 10) are traced to the True Shape of Almen Saturation Curves. Goodness of fit
range from 95.5% to 99.9%. Variance from target intensities range from -0.032 (-0.000032") to +0.077 (0.000077").